


Histograms Explained app for iPhone and iPad
Developer: Newmediasoup, LLC
First release : 10 Dec 2012
App size: 210.3 Mb
Whether you shoot with a DSLR or a point-and-shoot camera, this easy to use, easy to understand App will quickly improve your underwater photography as your cameras histogram is de-mystified and becomes your new best friend. Information in this App is useful for topside photography as well. Every shooter can benefit greatly from Histograms Explained!
Shoot like the pros! Histograms Explained is the second in the series of Underwater Photography Training Applications by David Fleetham & Marty Snyderman. With 80 years of combined professional experience in underwater photography, David and Marty share their tips to help you understand your cameras histogram for better images.
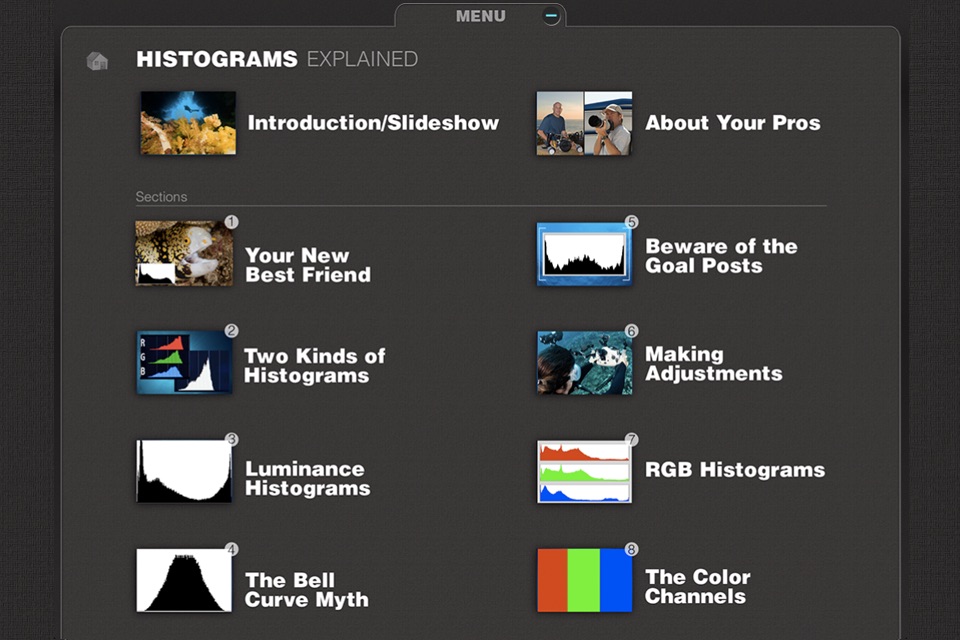
This App contains eight sections of training material, fully narrated, with photos taken by David Fleetham and Marty Snyderman to illustrate examples of histograms with their accompanying images, plus other training slides.
• Section 1: Your New Best Friend
• Section 2: Two Kinds of Histograms
• Section 3: Luminance Histograms
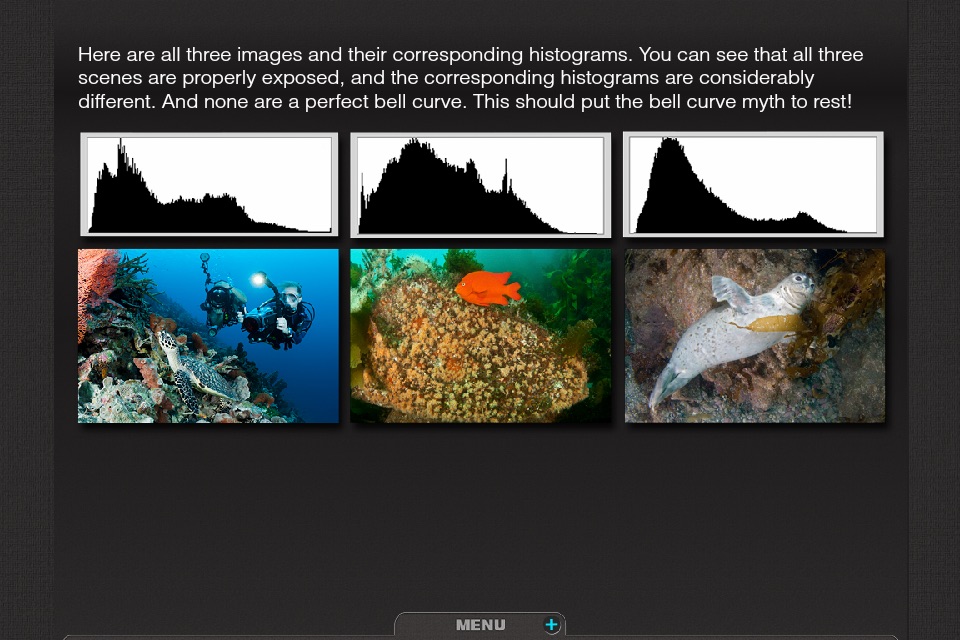
• Section 4: The Bell Curve Myth
• Section 5: Beware of the Goal Posts
• Section 6: Making Adjustments
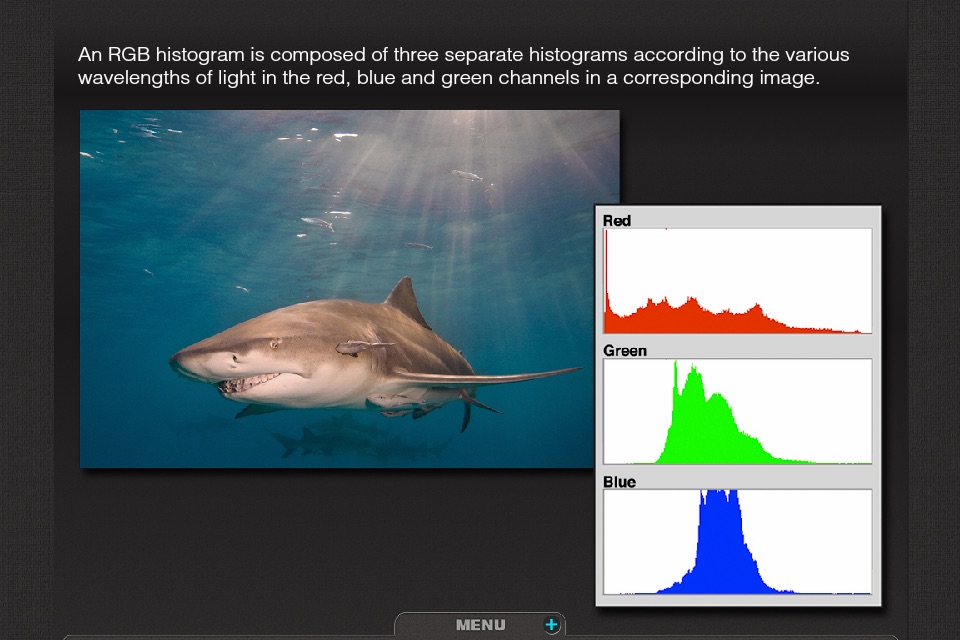
• Section 7: RGB Histograms
• Section 8: The Color Channels
Other features:
• Full narration
• Easy menu navigation
• Right-to-left, left-to-right swipe technology
• Chapter quizzes to reinforce learning
• One in a series of Underwater Photography Training Applications: Natural Light Images, Coordinating Natural Light and Strobes, Using Strobes Effectively, Silhouettes Underwater and Histograms Explained